Variables tied to the distribution of resources and economic productivity in a market are known as economic indicators and colloquially known by names such as the Unemployment Rate and Housing Market Index. The numbers that support these indicators exist on many Excel™ spreadsheets and are used to support policy decisions around the world.
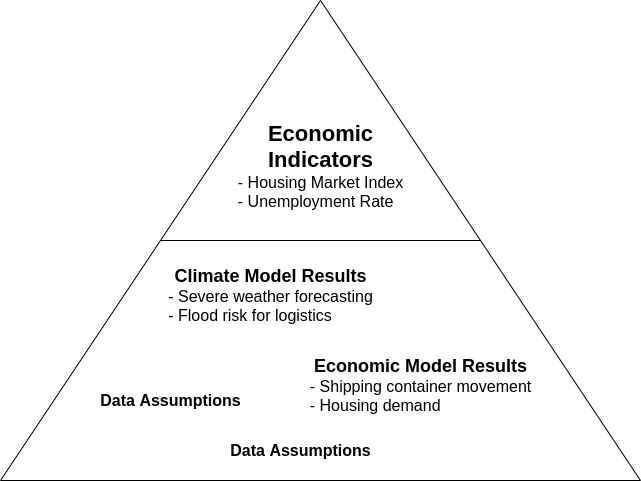
It’s a pyramid of model results and assumptions about economic indicators which drive the indicators themselves. Cloud geospatial technology has matured to a point where some of these assumptions about the natural environment can be measured and objectively tested using approaches as complicated as Deep Learning or as simple as trigonometry.
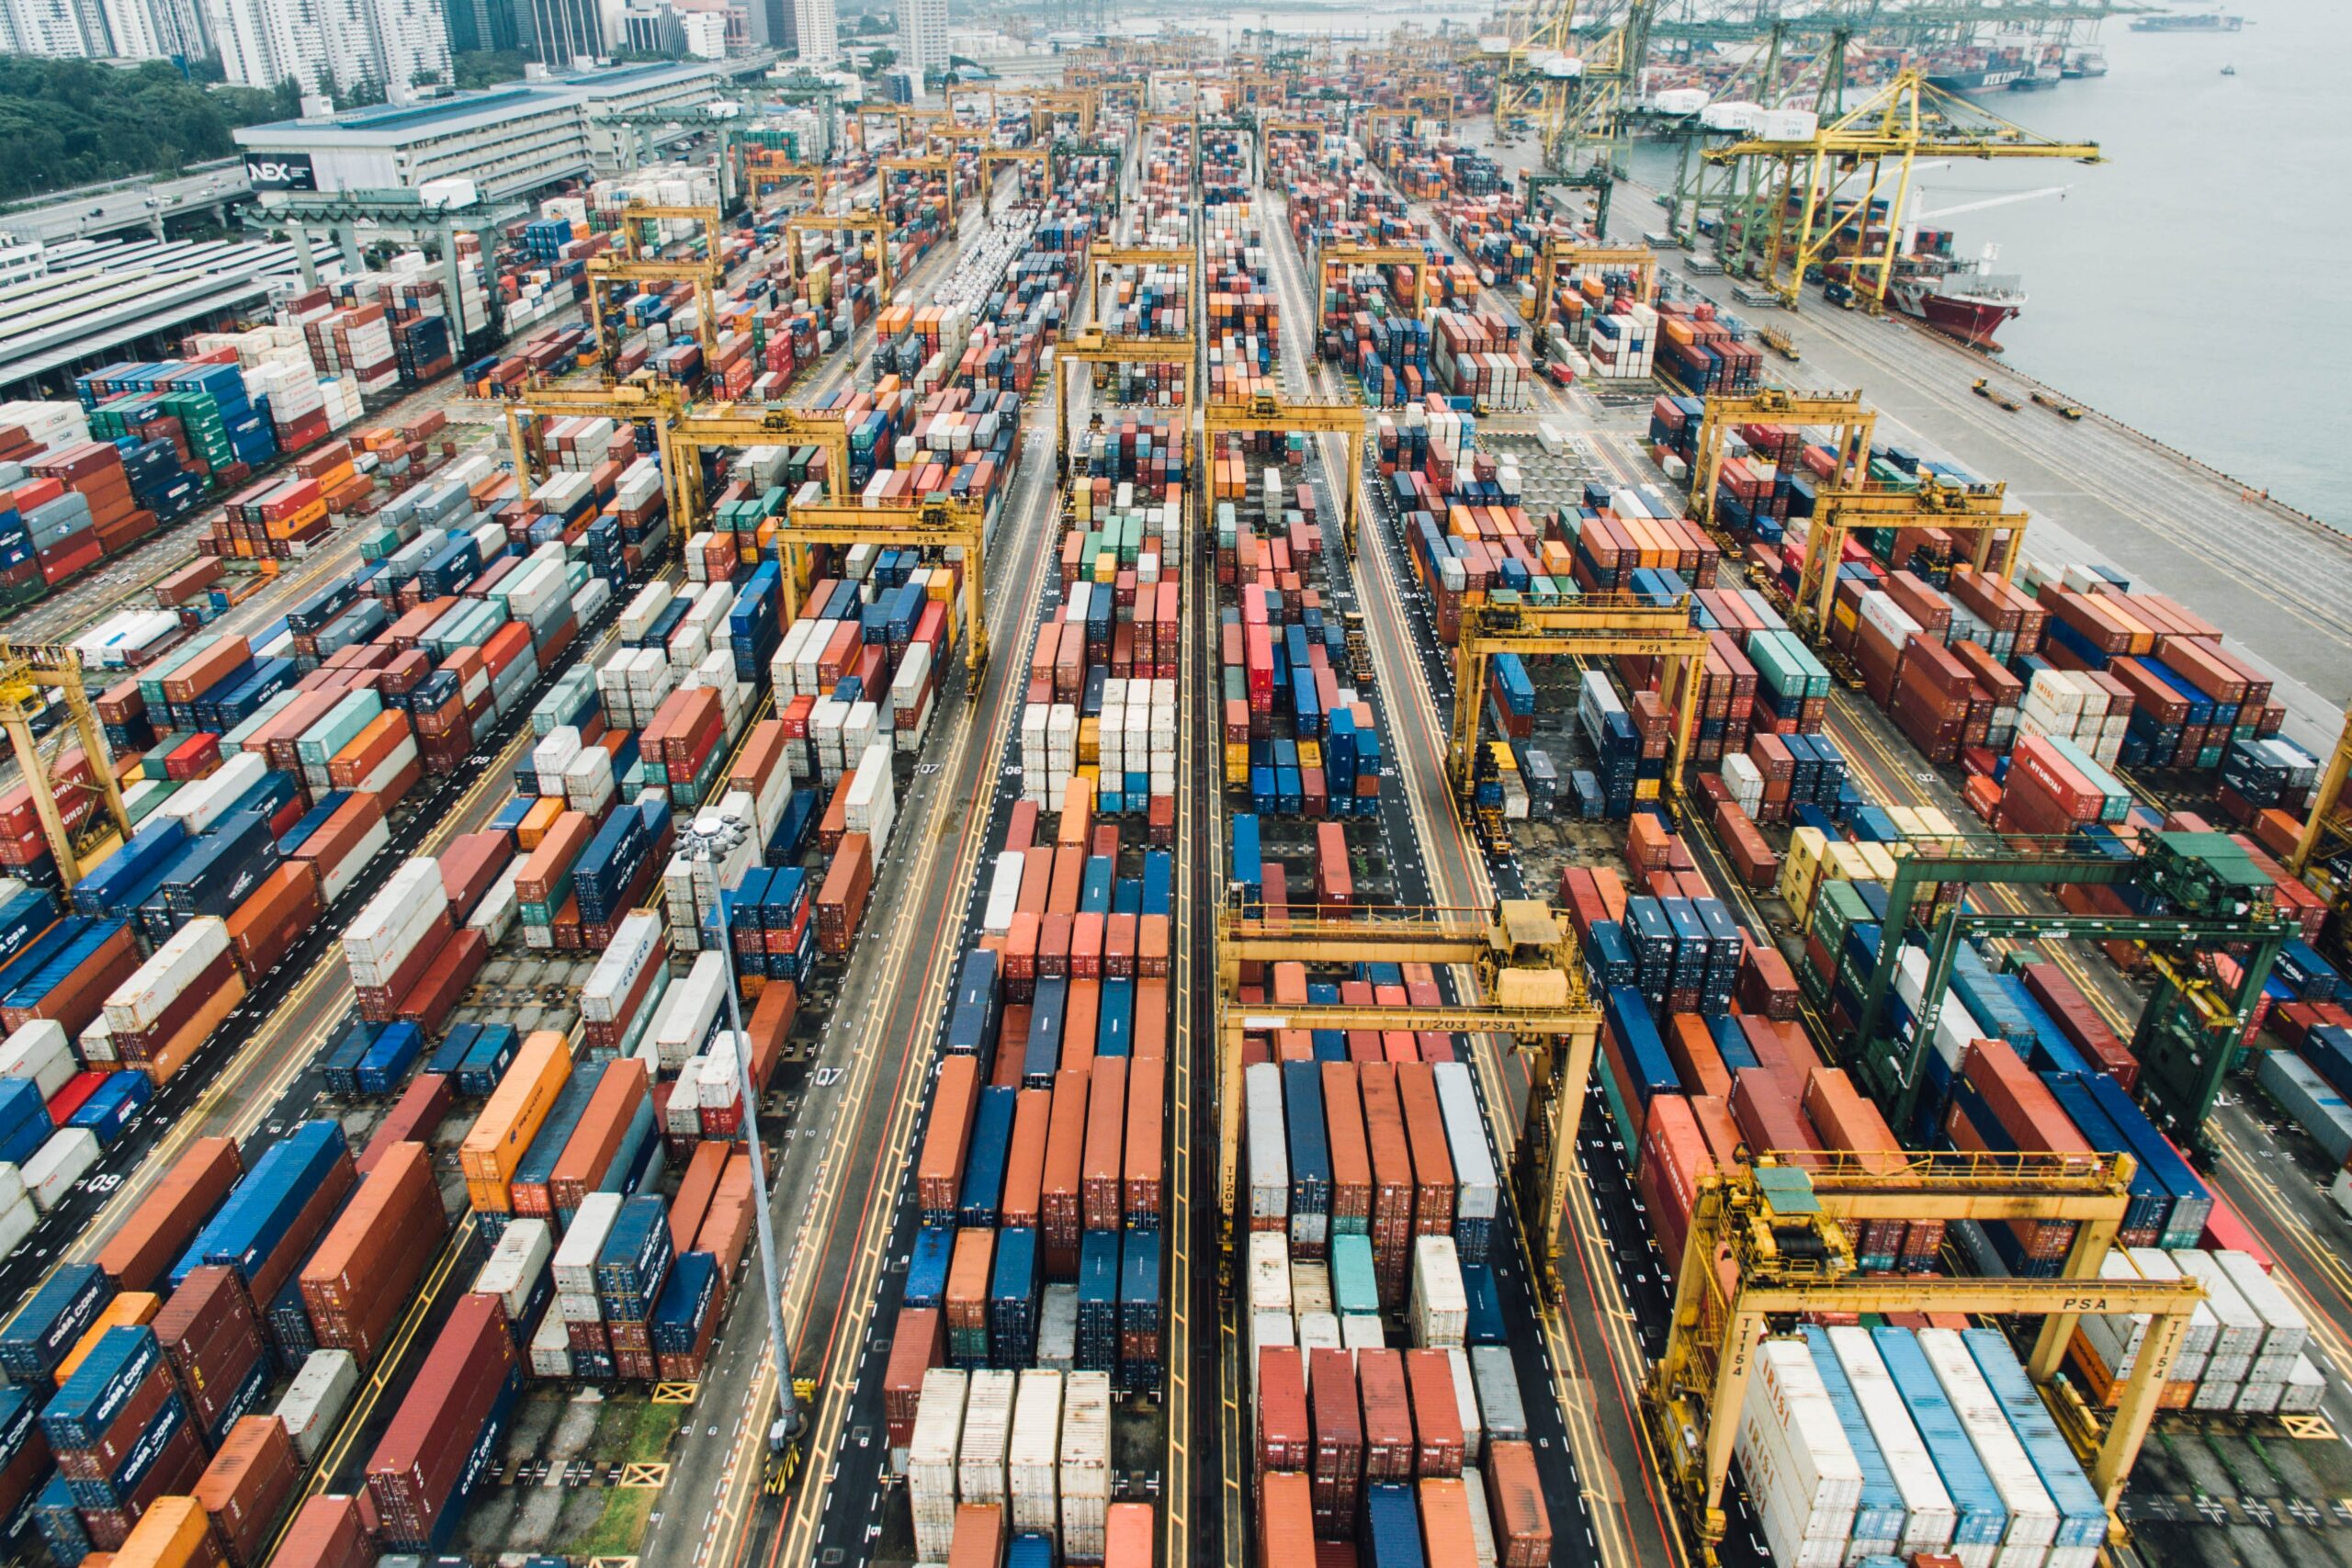
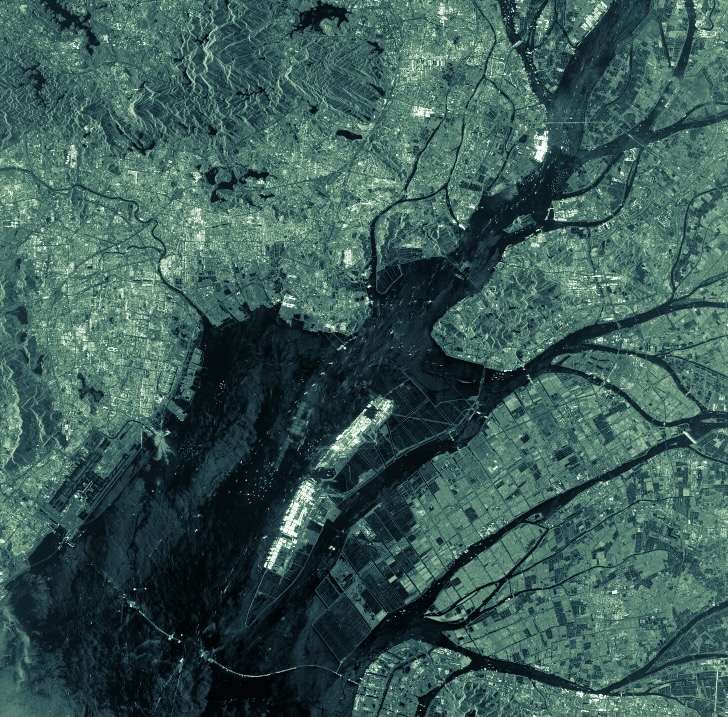
An example of one of these measurements is shipping containers coming into port. Each ship can have upwards of 24,000 containers (we’re not kidding), and the challenge of getting accurate counts across multiple ports becomes inefficient from a manual standpoint. For problems like this, satellite data becomes a valuable tool for a solution. The choice of data to use depends on the criteria of the issue at hand. The container problem requires us to see ports through all types of weather and at all hours of the day. The type of sensor that allows for all of this to be possible is called Synthetic Aperture Radar (SAR).
What is SAR?
Synthetic Aperture Radar or SAR is a method of capturing information about the Earth. Contrary to optical imaging sensors, which capture energy in the 750-2400nm range, SAR operates in longer wavelengths, around 1-30cm. The longer wavelength energy allows SAR to collect information through clouds and fog, typical of a maritime locale. SAR collects data by sending out energy and collecting the backscatter reflected off some surface. This makes SAR an ‘active‘ imaging technique. Data is processed to form an image based on the outgoing and incoming energy1 . Optical imagery (a type of ‘passive’ imaging technique) would not solve the container problem because it relies on reflected sunlight from the surface. Clouds block this energy source on cloudy days, and it’s unavailable at night.
An image’s spatial resolution is related to the ratio between the wavelength and the length of the sensor’s antenna (the part of the satellite that collects the backscattered radiation). SAR uses a scanning antenna and combines multiple smaller acquisitions to simulate a larger antenna, creating higher spatial resolution data. The looking angle of the sensor combined with the fundamental mode of acquisition (backscatter) causes geometries on the ground to appear quite different from how they do in optical imagery, and it takes a trained eye to interpret the results.
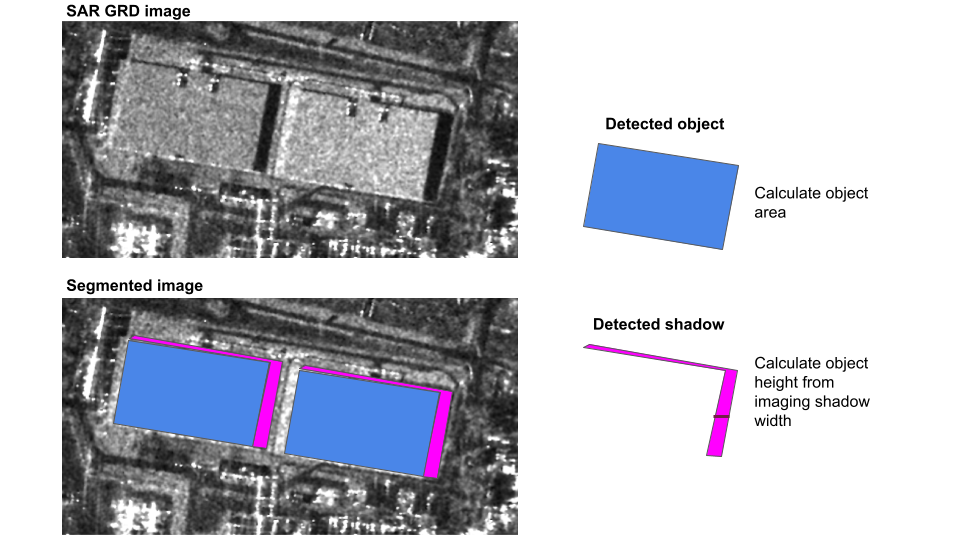
A scanning antenna creates side-looking acquisitions which are analogous to high oblique imagery. The side-looking aspect of data capture introduces distortions that lead to effects such as shadows. Shadows become extremely useful in counting containers where we need to gauge the 3D volume of the objects from a 2D dataset. In measuring the dimensions of the shadow and knowing the looking angle of the sensor, we can calculate the height of a container using our old friend trigonometry. Once we know the size of a single container, we can learn how many containers are stacked based on the shadow that a stack of containers has made. Completing these simple calculations lets us know how many containers, approximately, are in a given port at a given time.
We know a container’s dimensions, now what?
There are so many different objects in a port that cast shadows similar to what a container stack does. We can only count containers once we find an actual stack. Machine learning is a good approach and provides strategies to spot only the container shadows and ignore other objects.
We can train a computer to know what objects in the port are static by showing multiple datasets of the area over time—this way, the computer knows what to ignore. We generally understand the container and shadows and use this information to seed classification models. We look for specific criteria related to shipping containers and ignore things like ships and gantries.
Challenges like the container problem are a small subset of tasks that geospatial technologies like SAR tackle every day. The processing of SAR to create usable data that geospatial professionals can interpret is dependent on a lot of things working “just right”. However, ultimately for us, it comes down to the parameters of the problem at hand. Finding the best configuration and processing pipeline for a given task, such as finding shipping containers, is informed by the physics of the problem and by the end-user experience.
These are interesting problems that require interesting approaches: some traditional and some novel. We at Sparkgeo love to collaborate on projects and tackle exciting challenges using geospatial techniques. As the pyramid at the beginning showed, economic indicators build on a foundation of information. Established technologies like SAR and newer approaches like hyper temporal coverage allow us to verify and validate our data assumptions and model results on an ongoing basis.
1 Since SAR platforms are not optical camera systems, the monumental task of converting Radar data to something that resembles an image needs to be complete before subsequent processing.
Thanks, Gordon Logie, James Banting, James Townend, and Yann-Sebastien Tremblay-Johnston, for input.