


Discover, visualize, manage, and integrate EO data in a unified hub
When Dan, the Lead of our UK division, gave me a demo of the Earth Observation Data Hub (EODH) that we helped develop for the UK Pathfinder project, I was genuinely impressed. It made me think back to the frustrating days of struggling to find the right satellite image, and suffering through uninspired, utilitarian user interfaces. You know the ones. Grey bevelled boxes, clunky, overwhelming filters, no meaningful previews, and needing to download massive datasets just to find out if they were even the right fit. To top it off, you often had to navigate multiple, disparate repositories, each with its own frustrating interface.
Thankfully, those days are behind us. Thanks to cloud-based data, open standards like STAC, and constantly evolving geospatial libraries, such as TiTiler, Earth Observation (EO) data is becoming more available and easier to explore. The Earth Observation Data Hub is a stellar example of this progress.
The Back Story
Our journey with the EODH project began with developing a Proof of Concept for the Climate Asset Risk Analysis Tool (CLARAT), built using the Hub’s data and APIs. This was a great demonstration of our knowledge of EO data and our ability to build compelling web applications with it. Pleased with the result, and needing a team to help expand the EODH web interface, the project leads reached out.
After a big push to get the integrated catalogue and front-end data visualization up and running quickly, we delivered what I think is a functional and sophisticated interface and have since become responsible for running, maintaining and developing the EODH back-end services as well.
But let’s get back to the cool stuff the Hub can do.
A Unified Hub for EO Data in the UK
The EODH project, led by the National Centre for Earth Observation (NCEO) , looks to solve some of the most common frustrations faced by people working with EO and climate data. Whether you’re a government analyst tracking land surface temperatures, a private developer building a new app with high-resolution commercial imagery, or a scientist working with climate projections, the Hub removes the technical friction that usually kills innovation. The Hub is designed with UK users in mind. However, it is worth noting that many of the datasets have global coverage, including commercial imagery and climate variables.
Developed as a solution to the UK’s dispersed EO data landscape, it is a centralized access point for commercial, government, and academic users. What makes it unique is that it consolidates both open and commercial EO data alongside climate data, including current observations of climate variables and projections from climate models. No other platform offers this combination, bringing all these elements together and making them readily accessible.
Centralized Data: All You Need In One Place
The Data Hub is a centralized, STAC-based platform that brings together various data assets. This isn’t a new concept, but EODH does it really well. It is fast, visually appealing, and easy to navigate, allowing you to discover, search and visualize open and commercial datasets from different sources. These include satellite imagery, derived climate data such as land surface temperature, and climate projections such as CMIP6, CORDEX and UKCP. Many of the collections are not limited to the UK, and include global EO and climate datasets alongside regional products.
Once you find what you need, the data can be added to a personal or shared workspace with dedicated storage that becomes a central location for your EO and climate data.

Context-Sensitive Filtering: Reducing the Noise
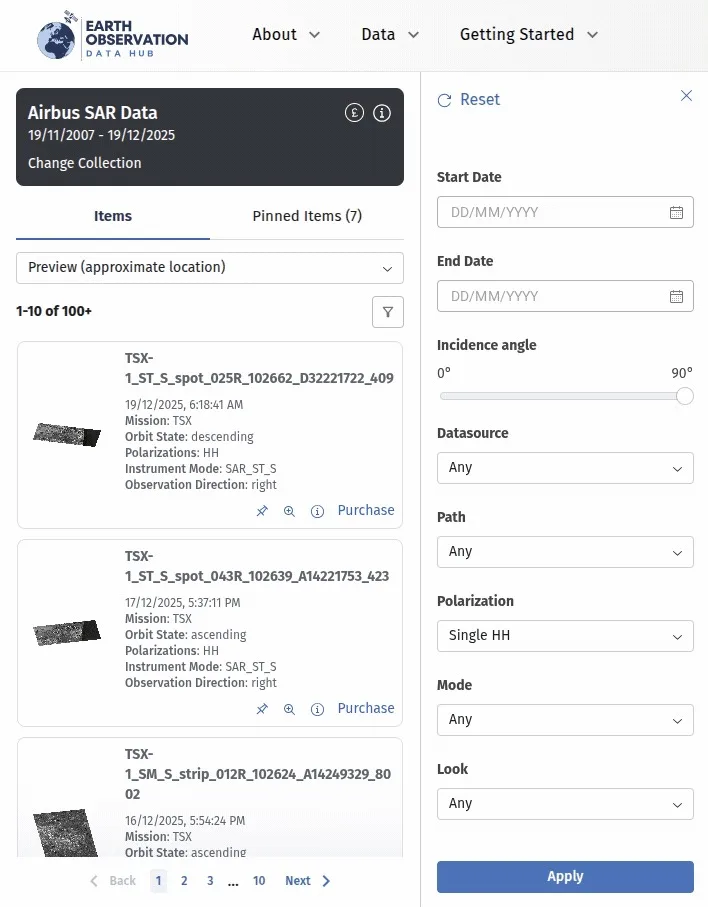
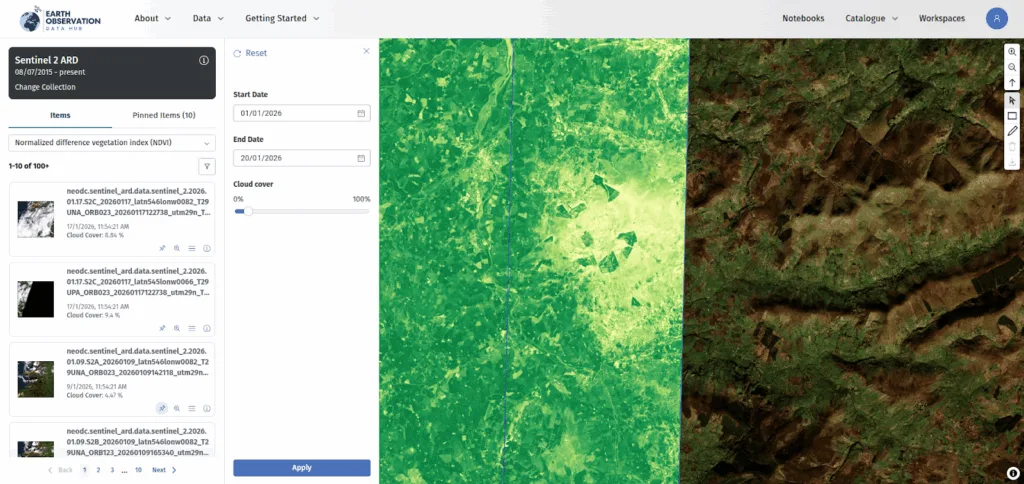
Finding relevant data is easier when you combine a digitized Area of Interest (AOI) with context-sensitive filtering that adapts to the data you’re viewing. This is particularly valuable when data sources are so varied. For example, the Hub offers a cloud-cover filter for optical imagery, but this is not relevant for Synthetic Aperture Radar (SAR) data, so it automatically switches to polarization and incidence-angle filters.
You can also filter climate projection data by variables such as precipitation or humidity, specific warming scenarios using Shared Socio-economic Pathways (SSPs), and the modelling institution responsible for the projections. These filters play a key role in improving data discovery across very different data types within a single, consistent interface.
Commercial Data Integration: Bring Your Own API Key
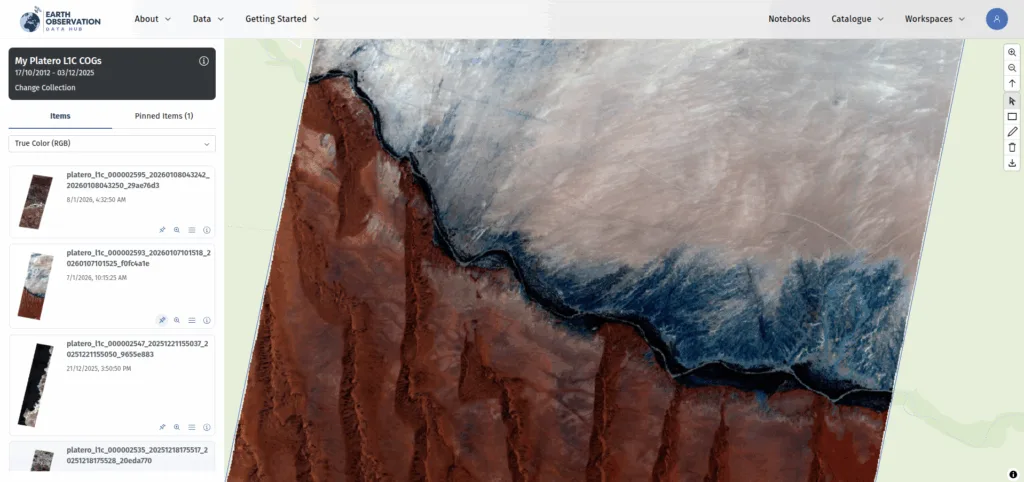
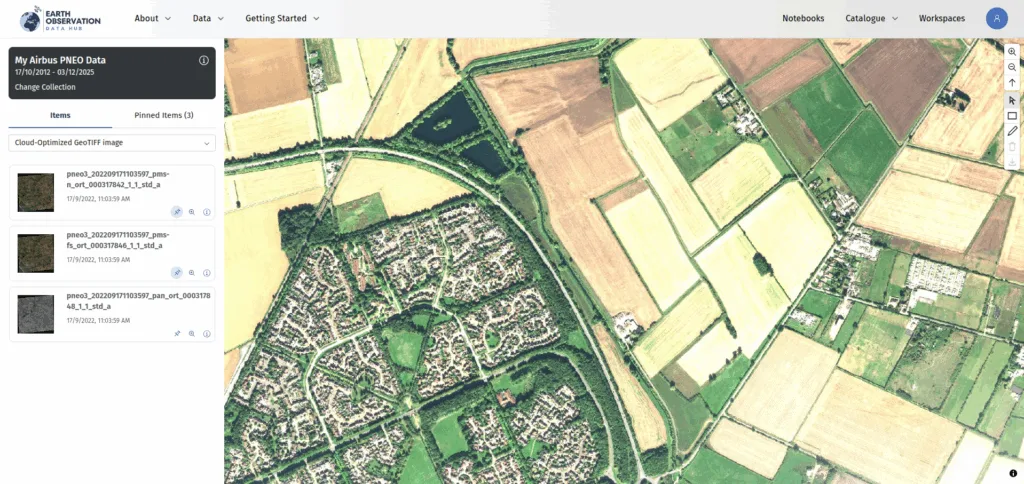
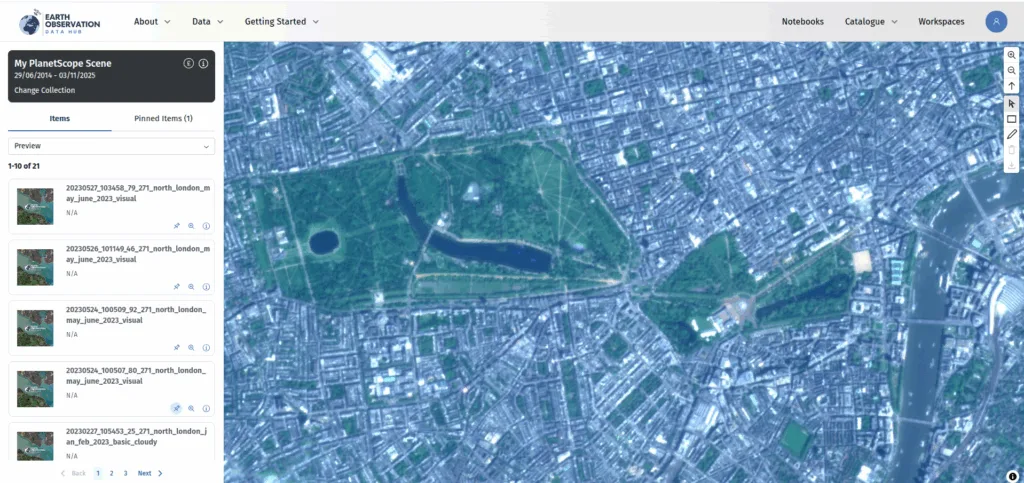
A unique and powerful feature of the Hub is the ability to use your existing API keys from providers like Airbus or Planet to purchase data. Why use the Hub? You can browse commercial data alongside open data, using the same interface and workflows. Once you find what you need and complete the purchase, it is delivered directly to your personal or corporate workspace.
As additional commercial data providers, such as OpenCosmos are added over time, this approach saves the time and frustration of jumping between multiple supplier portals and data management workflows. This is yet another way the platform reduces friction and saves time.
Advanced Visualization: Instant Insights via TiTiler
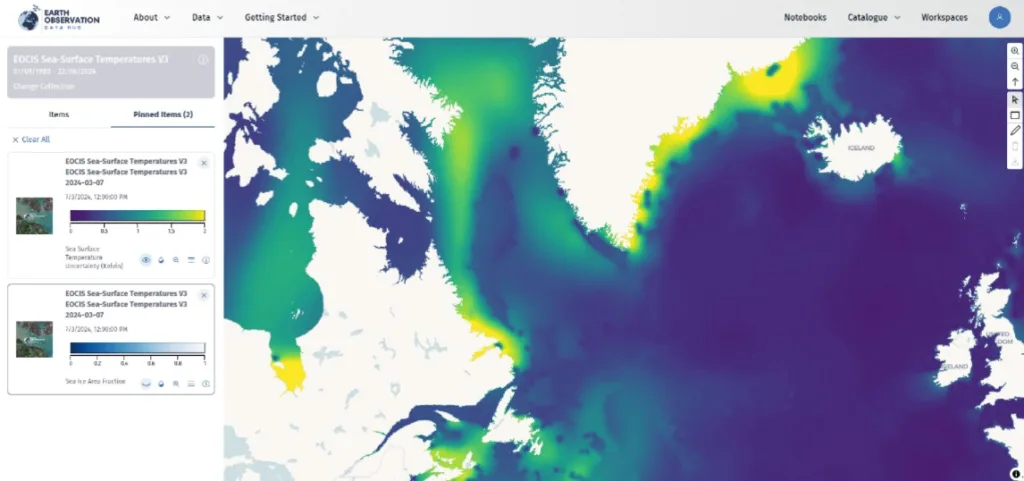
Using the TiTiler Python library, the Hub dynamically displays data at full resolution. More importantly, it performs fast, real-time rendering of common band calculations such as NDVI, natural color, or color infrared. This instant preview is incredibly valuable for quickly assessing data quality and relevance.
You can also visualize derived variables, where the data itself is stored within a multi-dimensional data cube, such as sea surface temperature or sea ice fraction, all directly in your browser.
Data Quality: Confidence in the Data
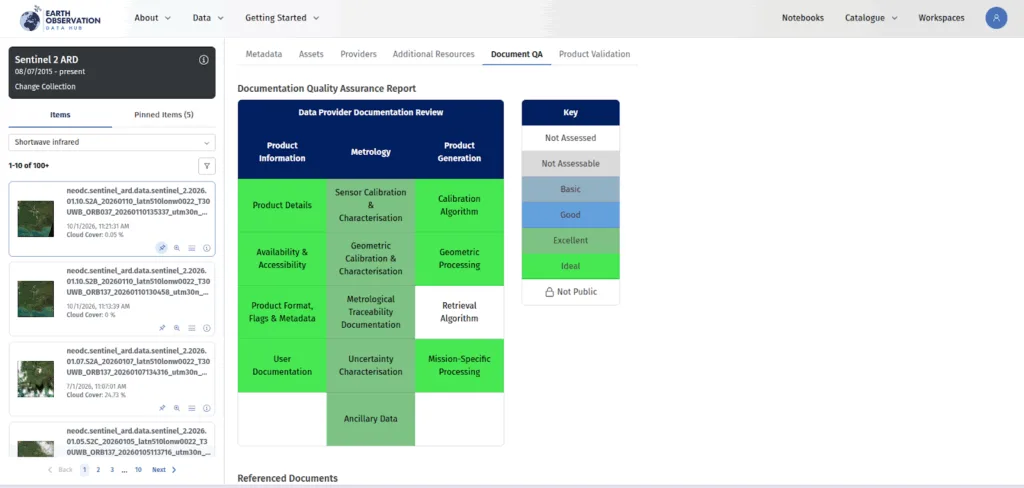
With data coming from multiple sources, being able to trust what you are working with is just as important as being able to find it. The Hub includes quality assessments carried out by the UK National Physics Laboratory (NPL), giving additional context on data completeness and fitness for purpose.
These assessments are integrated directly into the interface, helping you make informed decisions about which datasets are appropriate for your use case before committing time or resources.
XYZ Tile Service: Share the Vision
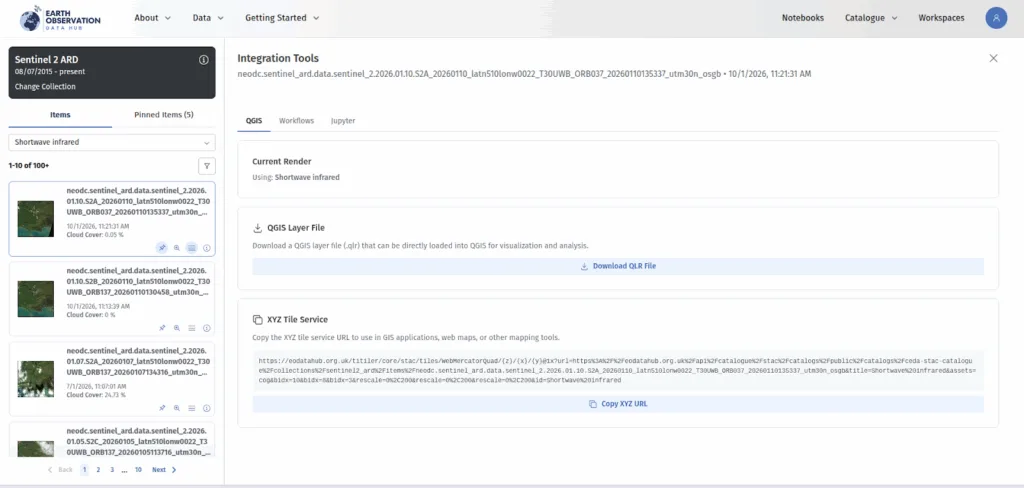
If you want to access a visualization outside of the Hub, you can do so via an external web map application or with QGIS. You can generate an XYZ Tile Service URL that can be copied and pasted straight into a web application or generate a QGIS layer file that connects directly into your desktop GIS software without downloading the data itself. This provides a quick and easy solution for connecting to full-resolution, cloud-optimized data outside of the Hub.
Near-Data Processing: Keep it in the Cloud
The more you know about an image before you have to download it, the better. Near-data processing is a key feature of the Hub, allowing you to work with data where it resides, minimizing data transfer and improving performance.
For data scientists, this means they have immediate access to analysis environments. You can launch a server with a pre-configured Jupyter Notebook to access any data stored in your workspace. This reduces the latency between accessing the data and meaningful insights.
Workflow Runner: Interoperability Special Sauce
The workflow runner allows Earth Observation workflows to be called via an OGC Processes API, using the EO Applications Best Practice standard. This enables users to develop, execute and publish processes such as water quality analysis, which other institutions can then run against their own data within the Hub.
The ability to share and reuse algorithms and workflows rather than rebuilding them makes collaboration across academia, government, and industry, much easier.
A New Standard for EO Access
This project is a great example of how we use open-source, cloud-native technologies and STAC-based architecture to make data easier for everyone. We are proud to be a part of a project that aligns so closely with our mission to increase access to data and, in turn, increase the insights derived from it.
The Earth Observation Data Hub is a truly premium product that is setting a new standard for accessing and working with EO data. If you are looking for EO data, save yourself the time and frustration of navigating distributed catalogues and check out the Earth Observation Data Hub.