

All of us have experienced it. You need to answer a simple question, but first you have to hunt through folders, download massive imagery datasets, and wait for your desktop to catch up. Before you have analyzed anything, you’ve already spent more time managing data than using it.
I recently spent some time working with City of Calgary Sentinel-2 imagery hosted in Prescient using a Jupyter environment, a lightweight open-source option. The experience was refreshing. Connecting to the data was simple and it allowed me to spend more time mucking around with the analysis and visualization.
I often work in JupyterLab, a web-based interface, as it is really easy to develop and tweak workflows within a computational notebook. An organization can share these notebooks and processes become quickly repeatable without storing outputs or altering the original data. Zero full-file downloads required. It means the data on Prescient remains the source of truth.
The Power of a Cloud-Native Geospatial Stack
Prescient makes data so much easier. Accessing data in the cloud to analyze and visualize on the fly is efficient. Prescient stores all data in STAC (SpatioTemporal Asset Catalog) format, an open-source standardization. STAC items are indexed and searchable instantly and use COG (Cloud-optimized GeoTIFF) for imagery. This means you can use it in your standard Python geospatial stack without having to reformat or deal with proprietary lock-in. Any STAC and COG aware application can read it, making it easier to incorporate into existing workflows. So let’s check it out.
Putting It to the Test
I was able to search, preview, and analyze the City of Calgary data faster than it would take to download the catalogue. Connecting to the SDK was smooth sailing. It allowed me to visualize and analyze without ever downloading a giant GeoTIFF to my desktop.
I queried the STAC catalogue to see what historic data was available and decide what data to use. It generated the list almost instantly.
search                             0.25 s   18.3 KB
3 items (metadata only - no pixels yet):
  calgary_2024-12-31
  calgary_2023-12-31
  calgary_2022-12-31
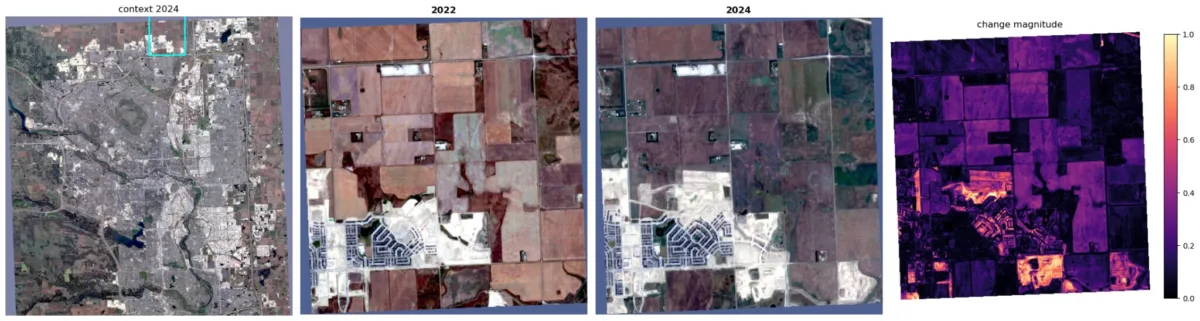
Knowing what data we had, I decided to look at new development in the city from 2022 to 2024. Now it’s time to look at the actual pixels.
On-the-Fly Analysis
After calculating the purely heuristic change magnitude for the whole area, I wanted to pinpoint significant change without manually panning through the city.

read full before + after 18.42 s 538.5 MBInstead of spending a bunch of time finding an interesting spot to zoom in on, a grid divided the area and calculated the total change for each section. This returned a list of sub AOIs that showed the most change. Here is a look at the sub-AOI I picked for each year alongside the calculated change magnitude:
Handling Only the Needed Pixels
I wanted to see the improvements in processing time and data read, comparing the full image with the sub-AOI.
By isolating just the sub-AOI, less data was being read and the processing times tended to be faster.
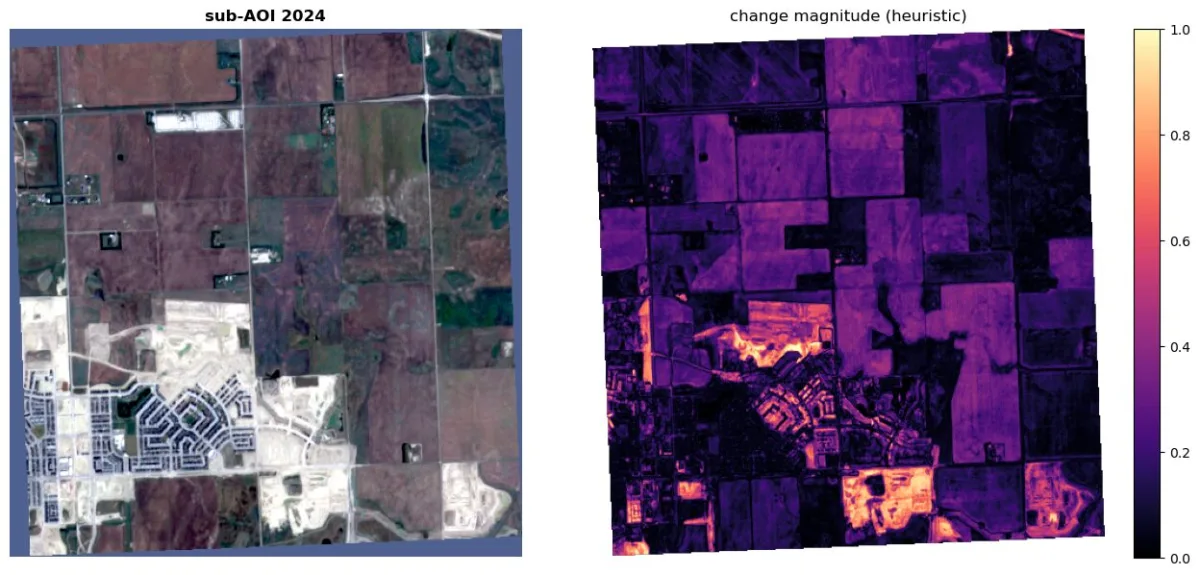
read sub-AOI before + after 1.08 s 9.9 MBYes, there are various factors, such as internet speed, that could affect the time, but I think it is safe to assume reading 9.9 MB is faster than 538.5 MB
read                             time     data read
---------------------------------------------------
read full before + after      18.42 s      538.5 MB
read sub-AOI before + after    1.08 s        9.9 MB
sub-AOI: 54.4x less data, 17.0x faster on average
Now, imagine your process involves repeatedly reading your AOI for processing and analysis or to repeat this on many images. This could save some time.
The Takeaway
This shift in how we store and access geospatial data is changing everything. The more data an organization has, and the more people who need to use it, the more important it becomes to have a centralized source of truth.
Prescient bridges the gap between your data and your workflows, allowing instant access to data where you need it. Standardization and open-source tools make access easy so more time can be spent mucking around with analysis and creating visualizations instead of being bogged down with managing data.