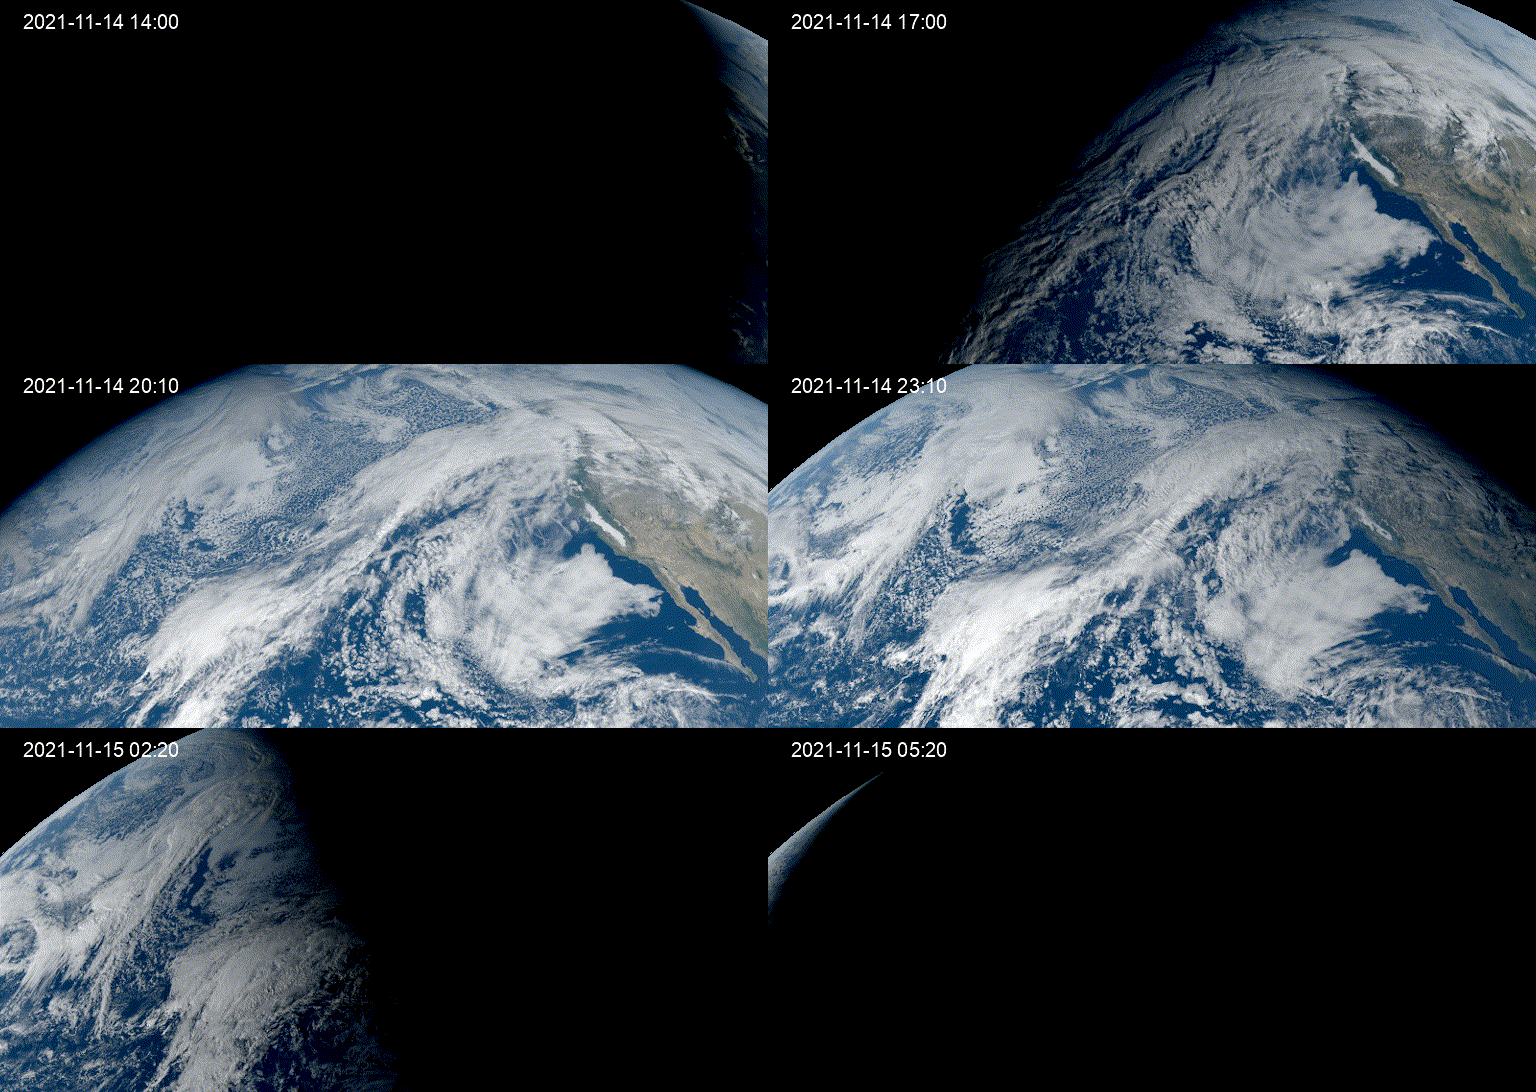
Time-lapse of the November 14 atmospheric river event, acquired by the GOES-17 satellite
On November 14, southern British Columbia experienced the devastating effects of an “atmospheric river” – a narrow band of enhanced water vapour transport that flooded the Fraser River basin. This atmospheric river event broke 20 rainfall records across British Columbia. The city of Abbotsford experienced 150mm of rainfall over the span of two days, and experienced major flooding in the adjacent agricultural region, the Sumas Prairie. The Sumas prairie, once known as Sumas Lake, was drained in the 1920s and converted to agriculture, becoming one of the most productive agricultural regions in BC. The prairie has been maintained through the diversion of water through dykes and the Barrowtown pump station which works 24/7 to prevent the Sumas prairie from turning back into Sumas lake.
We expect more atmospheric river events in the future as climate change intensifies. There is a need for better prediction, monitoring, and management of these events to mitigate the damages caused by flooding. Using synthetic aperture radar (SAR) remote sensing images, the team at Sparkgeo mapped the flooding in the Abbotsford region to better understand the extent of this severe flood event, and help to mitigate future flooding events through detection and monitoring.
Flood Mapping
Using SAR imagery, we can penetrate cloud cover and see the ground clearly during storms. This makes radar a powerful tool for monitoring flood events. This cloud penetration proved crucial for this work, as the post-flood images from optical satellites such as Landsat-8 and Sentinel-2 were all obscured by clouds. This work used data from the Sentinel-1 satellite constellation, operated by the European Space Agency (ESA).
We retrieved 4 Sentinel-1 GRD (ground range detected) images covering the Abbotsford area and the North-Western portion of Washington. Two of the images were taken before the flooding (November 04 and 13), and two were taken after (November 16 and 20). These images were grouped into two before/after image pairs for change detection – Nov 04/Nov 16, and Nov 13/Nov 20. After preprocessing the data, we created the flood detection layers using a change detection algorithm. The algorithm highlighted areas of surface water in the post-flood images which were not present in the pre-flood images to create a flood map.
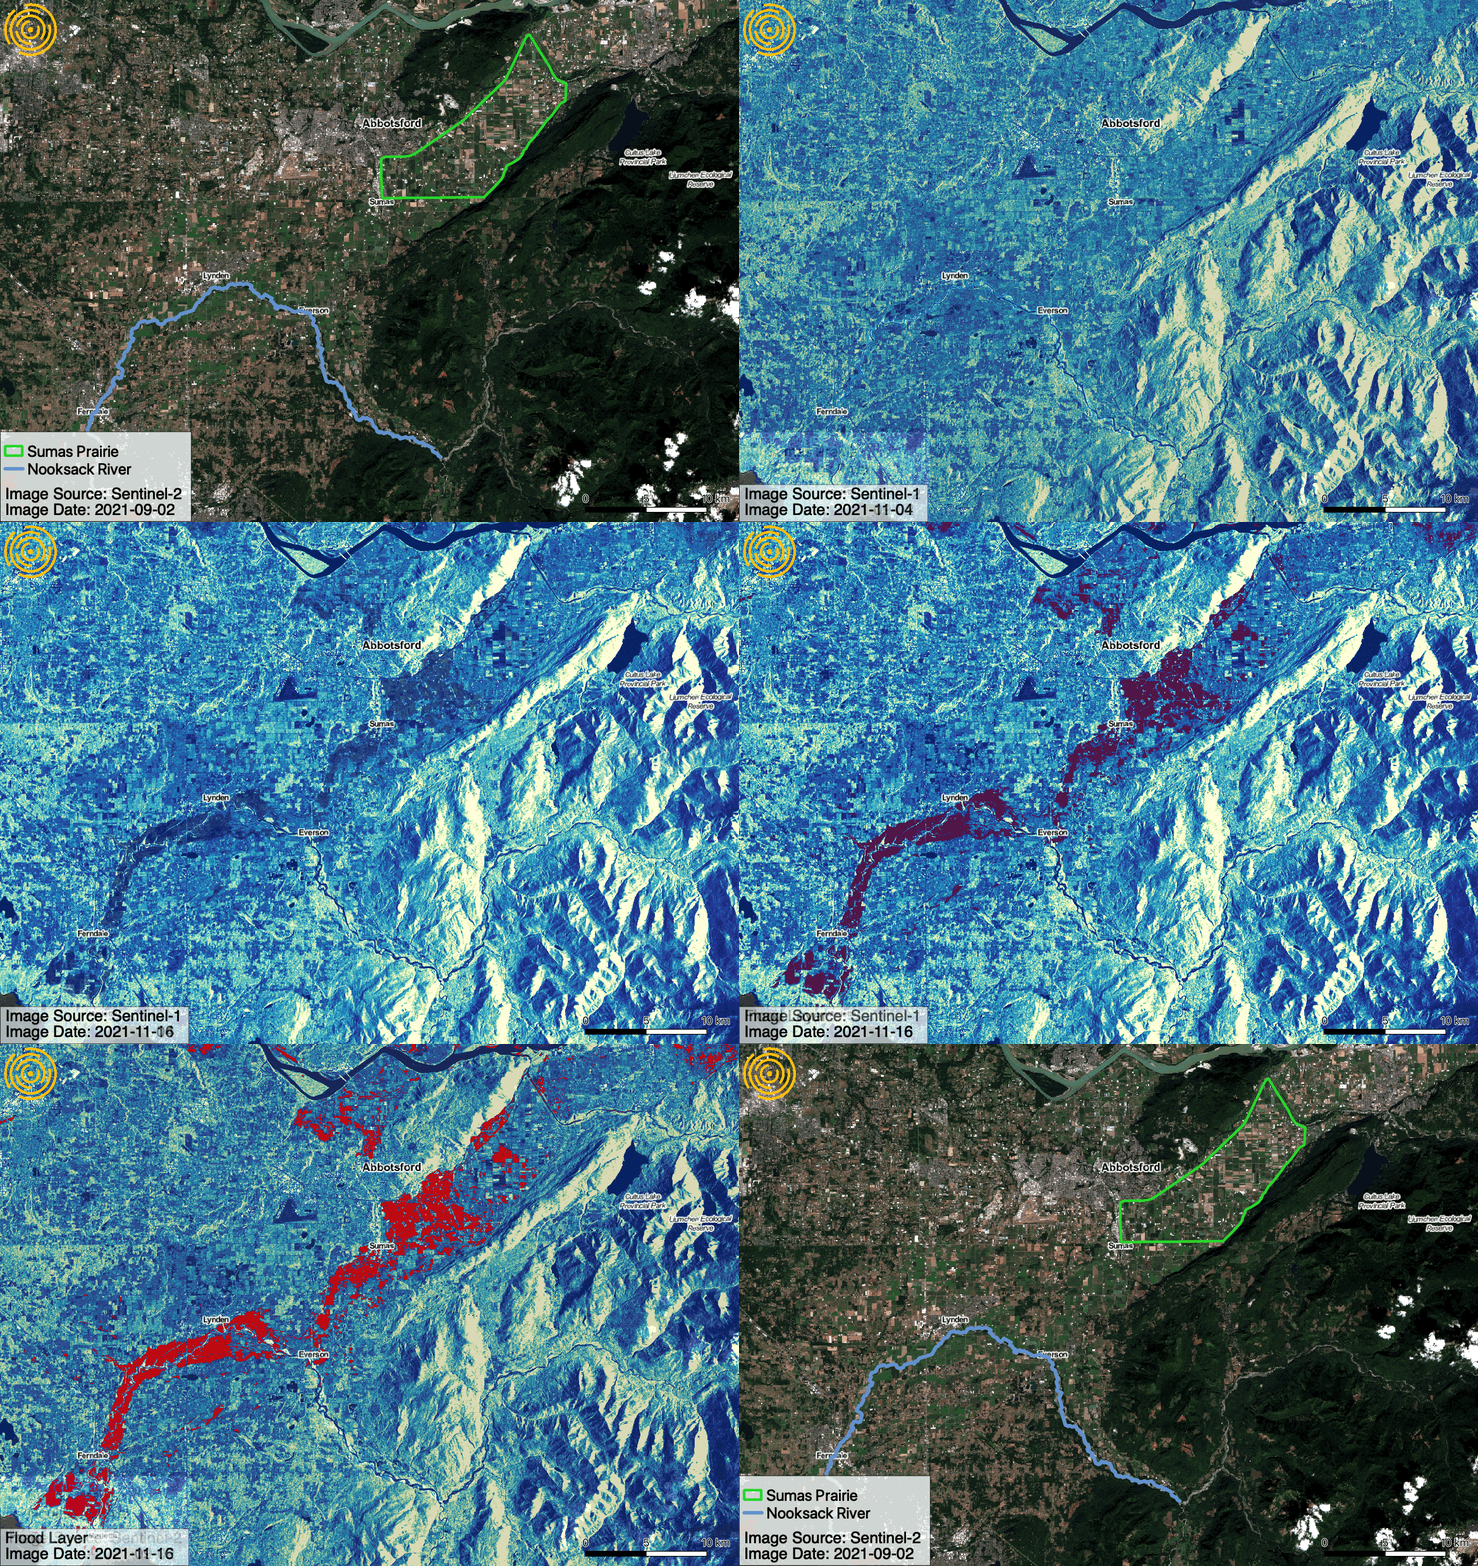
Animated gif showing the flood detection layer generated for the change between November 4 and November 16.
The first natural colour image in the above gif is an optical satellite image from Sentinel-2 showing both the Abbotsford region as well as portions of Washington state around the Nooksack river. The SAR data in the second two images are symbolized using a gradient blue colour ramp: darker shades of blue indicate a weaker radar return signal, while brighter shades indicate a stronger return. Water appears dark in SAR imagery due to specular reflectance, with the water surface reflecting the majority of the radar pulse away from the sensor, resulting in a weak return signal.
We see a significant amount of dark areas appear between the first and second SAR image. These are the standing water from the floods. Significant flooding can be seen around the Nooksack River and the Sumas Prairie South-east of Abbotsford. There is also a significant amount of water present in between the Nooksack river and the Sumas Prairie, reinforcing the conclusion that water from the Nooksack flowed North-east into the Sumas region. We can see there was also significant flooding north of the city, on the flood plain adjacent to the Fraser river. This flooding is unlikely to be related to the overland flows from the Nooksack river, and more likely was the result from either the Fraser river overtopping its banks, or from rain water flowing into the area from Abbotsford and the surrounding areas.
Looking at the flood detection layer (shown in red), it appears that our algorithm was able to detect the flood waters while avoiding false positive detections of other dark targets like the airport in Abbotsford and Cultus Lake, directly East of the Sumas Prairie.
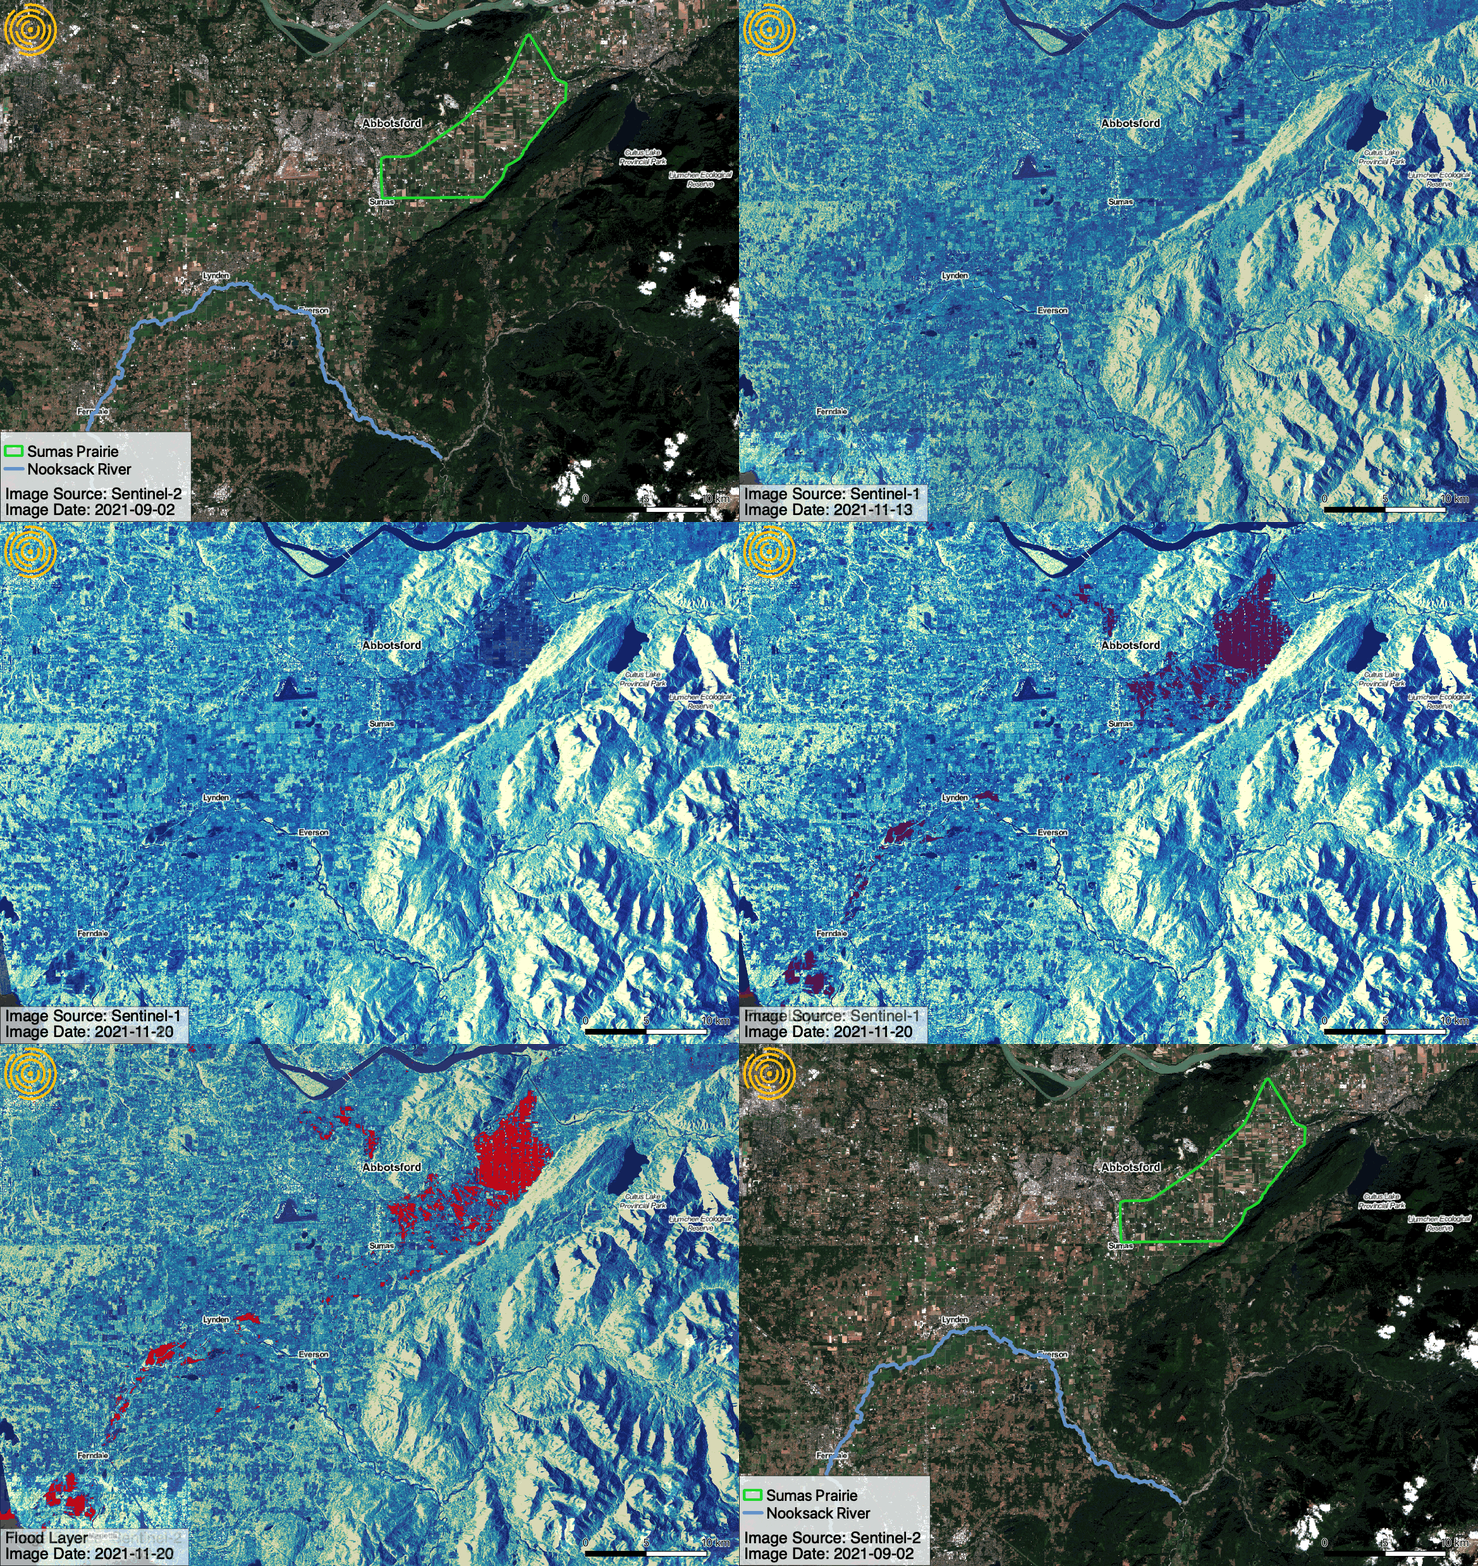
Animated gif showing the flood detection layer generated for the change between November 13 and November 20.
Comparing the two flood maps, we can see how the situation rapidly evolved. On the 16th, flooding was concentrated around the south-west portion of the prairie near the city of Abbotsford. By the 20th, while significant flooding remains in the southwest Sumas Prairie, it has reduced significantly. The amount of flooding north of Abbotsford is likewise reduced compared to before. By contrast, the north-east portion of the Sumas Prairie, which appeared to be mostly dry previously, is now inundated. This shifting of the flood waters is most likely due to the breaching of several sections of the Sumas Dike, one of the major dikes which protect the prairie from regular flooding. With the dike breached, water from the flooded Sumas river was able to flow into the previously-protected north-east prairie. The rapid change in the distribution of this flooding is difficult to monitor without flood mapping, and is essential for mitigation of the floods and to determine where emergency resources and efforts should be focused.
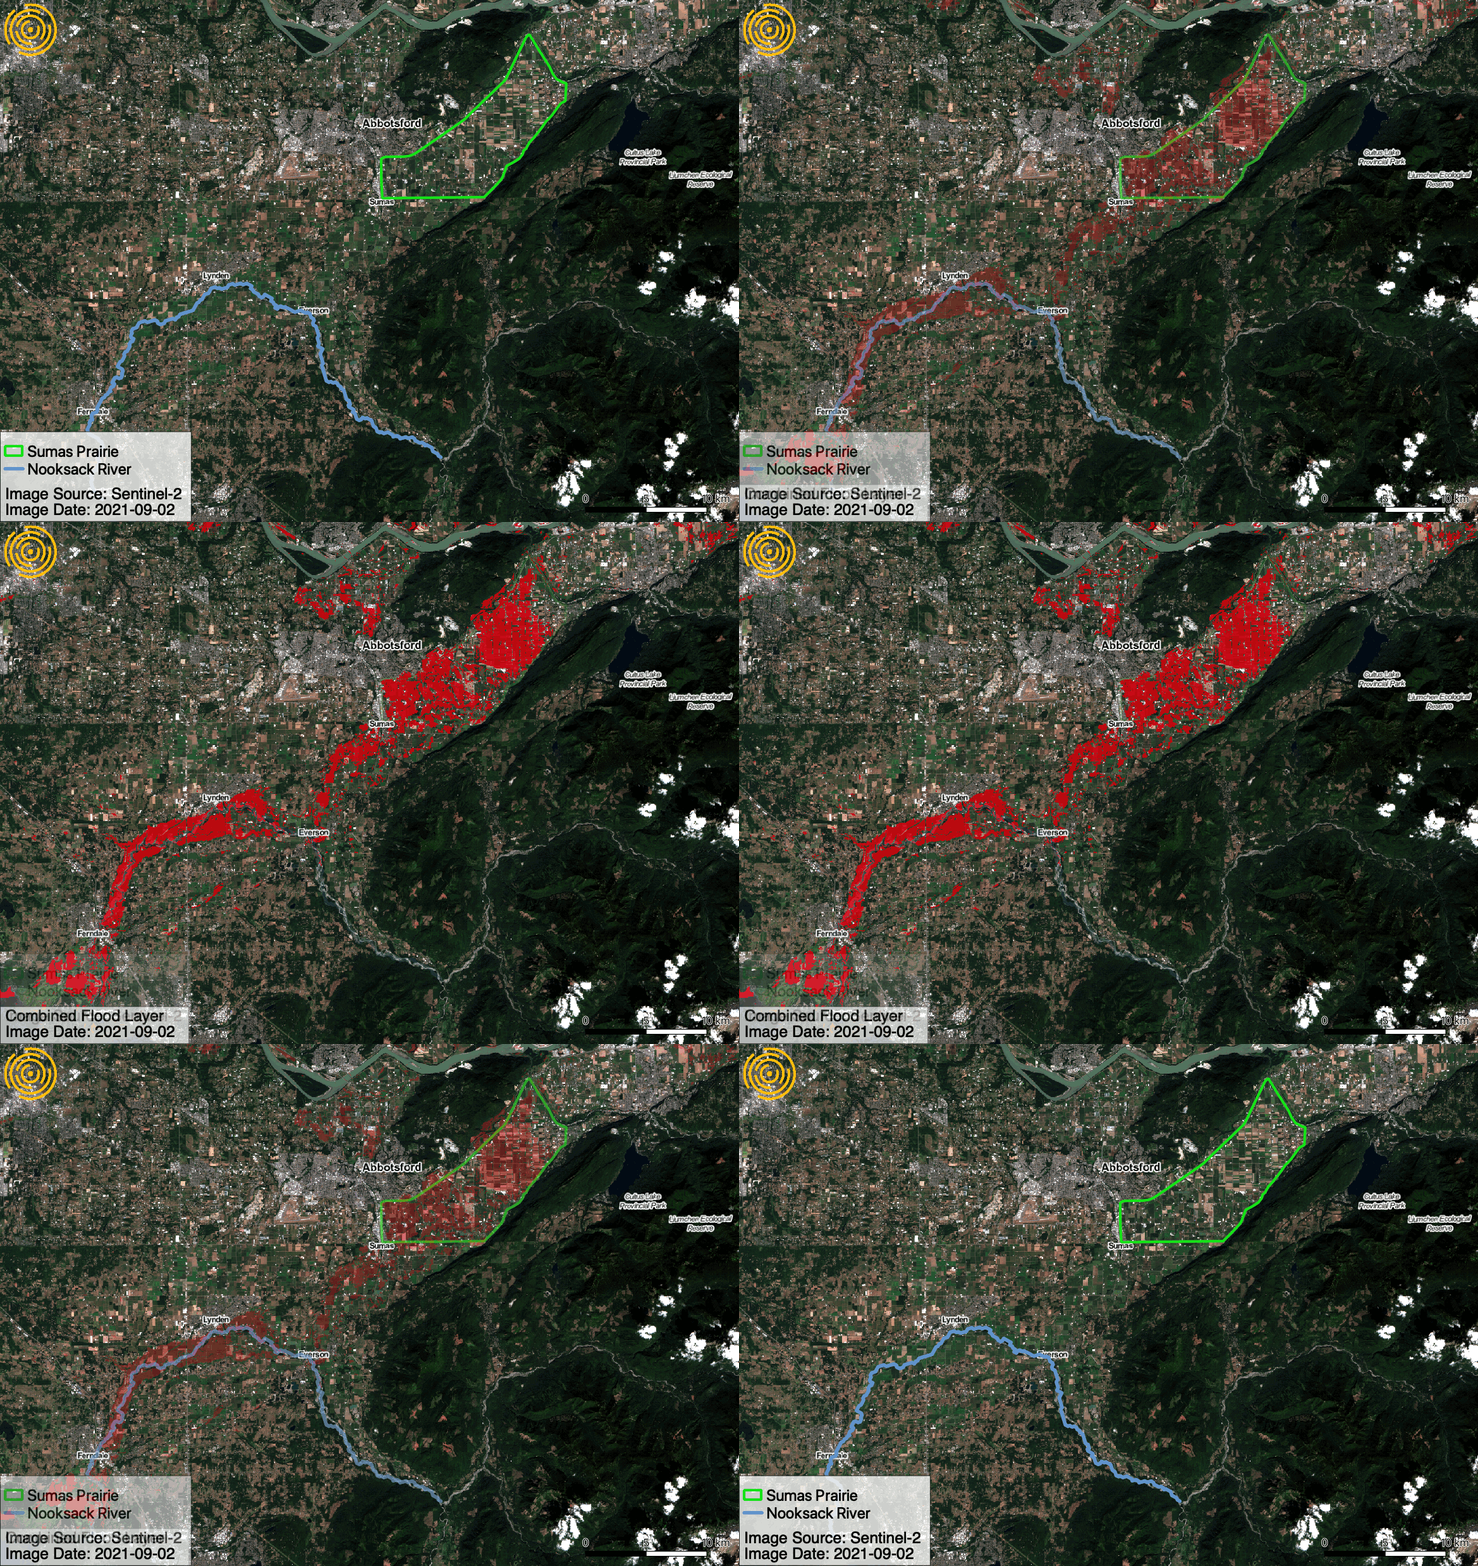
The combined flood map generated from both sets of images overlaid over Sentinel-2 imagery.
The final gif shows the combined detected flood area overlaid on the Sentinel-2 optical image. These images show the culmination of the significant flooding accompanying this weather event, especially in the Sumas Prairie.
As of this writing, this devastating flood continues to unfold. While the dike breaches have been repaired and flood waters continue to recede, there is significant rain forecast for the area in the upcoming days, meaning there remains a very real possibility of further flooding.
By using remote sensing data and analysis techniques like those demonstrated here, we can track these flood events in near-real time. SAR imaging, with its ability to penetrate cloud cover, is a particularly powerful tool for flood monitoring. This analysis used Sentinel-1 which can image an area approximately once every 2-4 days, depending on the latitude. This imaging frequency may not be adequate for fast moving disasters which can change rapidly; however, new SAR imaging sources are becoming available which promise the ability to revisit an area daily, or even multiple times per day.
This blog post is based on flood mapping technology developed by data scientist Gordon Logie.
Thanks, Gordon Logie, James Banting, and Natalia Domarad, for input.

