This work is also available in the form of a scrolling story map. Please follow this link to access the map.
2021 was a very damaging year for the Canadian province of British Columbia (BC), with the weather exacting a heavy toll. A record-breaking heatwave led to a severe wildfire season. Following these, an extreme winter rainfall event led to catastrophic flood damage which cascaded through the Canadian economy, disrupting major arteries for travel and trade.
Here at Sparkgeo, we are interested in the role that geospatial technology can play to help commercial organizations, municipalities, and the general public adapt to the challenges of a changing climate.
We believe that geospatial technologies can help not only to assess the damage from climate disasters but also help reveal the underlying geographical factors that contribute to where and why damage occurs. This type of analysis may enable models to predict a particular location’s exposure to climate-related risk factors.
To explore this further, we present a research project examining linkages between the wildfires and subsequent flood damage in 2021.
The Heat Dome and Wildfires
In late June an extreme heatwave gripped British Columbia, shattering temperature records in many locations. This event, referred to as the “heat dome”, was estimated to cause almost 600 deaths.
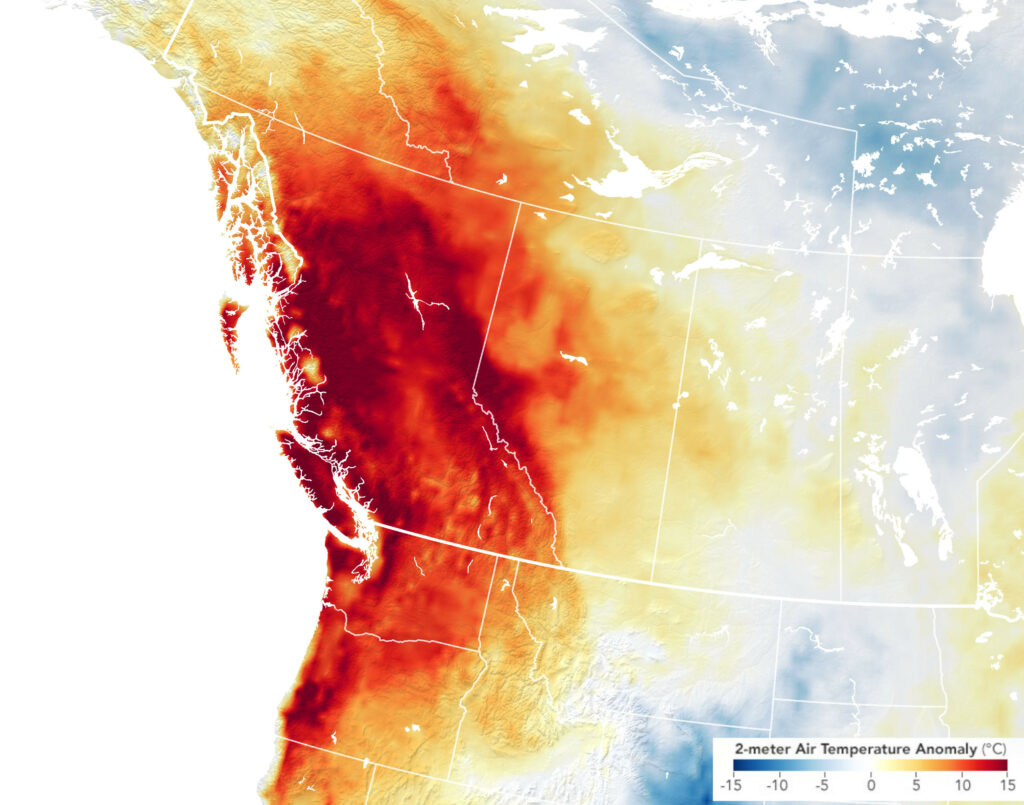
Map showing temperature anomalies on June 27, 2021 for western Canada and the northwestern United States. Temperature anomalies are measured relative to the same-day temperature average during the 2014-2020 time period (image source).
Aside from the direct human and economic costs associated with the heat dome, it provided the warm and dry conditions needed to fuel the 3rd worst wildfire season on record.
While only the 3rd worst in terms of area burnt, the 2021 season was notable for the number of large fires that burnt very close to populated areas.
This fire season caused some tragic events, most prominently in the village of Lytton. Between June 26 and 29th, Lytton consecutively broke the record for the warmest all-time temperature in Canada. One day later, Lytton burnt to the ground, engulfed by the Lytton Creek wildfire which rapidly swept into the community, sadly resulting in 2 deaths.
Another major wildfire was the White Rock Lake fire, which burned in the Central Okanagan region between Kamloops and Vernon, prompting the evacuation of thousands of nearby residents and burning through the community of Monte Lake.
The Atmospheric River
Timelapse of the atmospheric river on November 14, 2021 captured from the GOES-17 satellite. Animation created using Streamlit for Geospatial.
In mid-November, an atmospheric river brought intense rainfall to south-western BC and northern Washington. Rainfall records were set in 20 communities in BC. In the town of Hope, almost 280 mm of rain fell from November 14 to 15.
This storm caused massive flood damage across much of southern BC. The low lying Sumas Prairie near the city of Abbotsford experienced significant flooding, something we have written about previously. The town of Merritt was evacuated due to flooding from the surging Coldwater River.
The storm also caused significant damage to highways and railways. Flooding and landslides damaged and destroyed bridges and entire sections of major highways and railways, leading to closures.
Both the Trans-Canada Highway and the Coquihalla Highway were impacted, two of the main arteries connecting the south coast of BC with the rest of Canada. These highway closures led to Vancouver, Canada’s 3rd largest city and largest port, being cut off from the rest of the country.
Due to both the cost of repairing the damage as well as the economic impact of supply chain disruptions, the flooding of November 2021 may end up being Canada’s costliest natural disaster.
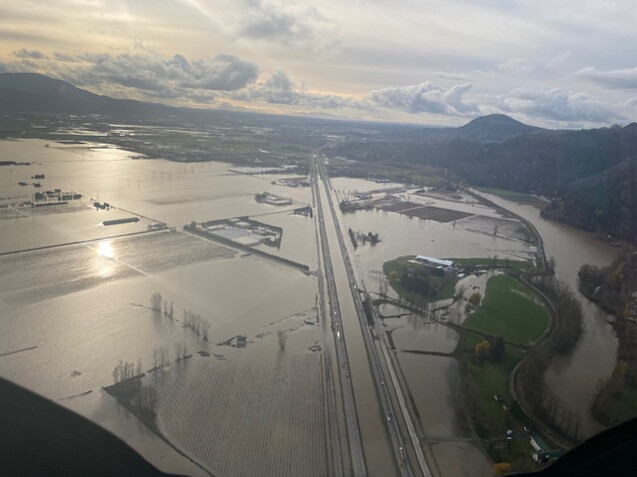
View of the inundated Trans-Canada Highway near Abbotsford (image source).
Wildfires Enhance Flood Risk
Aside from the unfortunate close timing, the wildfires and flooding in southern BC may appear to be entirely separate disasters at first glance. However, damage from the fire may have contributed to making the flooding worse.
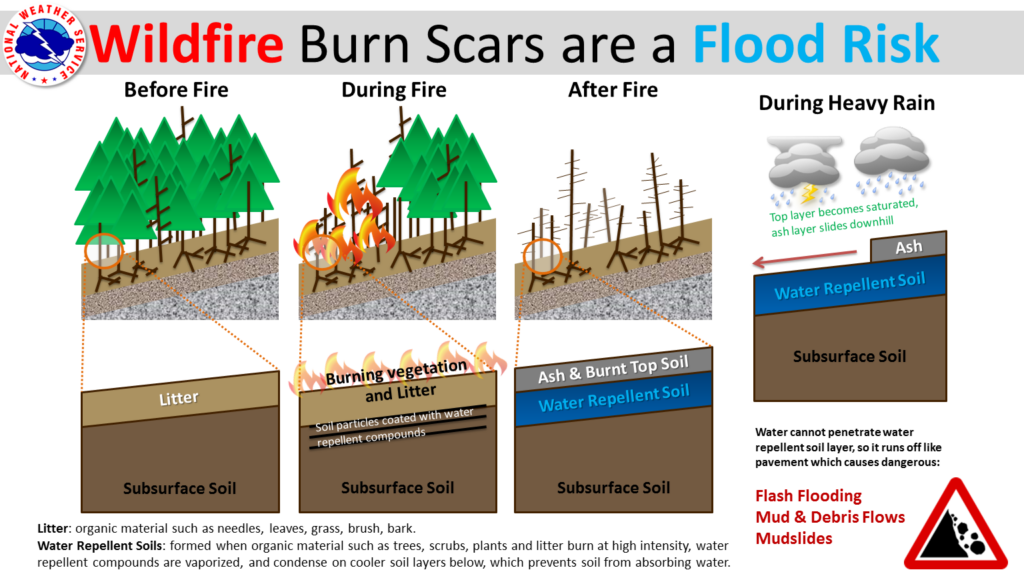
National Weather Service diagram showing how fires create a water repellent soil crust, increasing the risks from runoff and erosion (image source).
Severe fires can cause a water-repellent crust to form over the soil, reducing the ability of rainfall to infiltrate. This increases runoff during rain events, causing more water to enter streams and rivers and increasing the likelihood of flood damage.
This water repellency can last for several years after a fire, and severe burns can enhance the effect and make it last longer.
Fire burnt soils are also more prone to erosion from the loss of vegetation cover and the changes to the physical characteristics of the soil. More erodible soil increases the risk of landslides and mudslides during severe rainfall events.
Given the above, we wanted to further explore how the 2021 BC wildfires and flooding may be linked.
Mapping Fires using Satellite Imagery
Satellite imagery can be used to map damage from wildfires. Aside from mapping the extent of the burn, remote sensing data can also assess the severity of the fire burn (some examples here, here, and here). This is important, as the most significant and longest-lasting effects following wildfires are associated with severe burns.
For this study, we mapped fire burn extent and severity in southwest BC for 2021. We developed an approach combining multiple types of satellite imagery.
The first source of data was the NASA Fire Information Resource Management System (FIRMS). This system monitors fire activity on a daily basis by mapping thermal hotspots.
FIRMS data has a fairly low spatial resolution (pixel sizes range from 375 meters up to 1 km), meaning that the fire extent could be estimated from this data, but only crudely. The daily availability of this data, however, allowed the fire start and end dates to be accurately obtained.
Using FIRMS, we mapped the rough extent of southern BC fires and estimated the start and end date for each.
The next step in the analysis used data from the ESA Sentinel-2 satellite constellation, which has a 20-meter pixel size. We used the fire extents from our FIRMS analysis to define the Sentinel-2 image area search window for each fire.
Using the fire start and end dates derived using FIRMS, we retrieved images from before the fire started as well as after it was extinguished. These before and after images were compared using a change analysis algorithm, allowing the fire burn severity to be mapped.
The fire severity output data were broken into different severity classes. For this work we only used the 3 highest fire severity classes: Moderate, Moderate-High, and High severity. This is because the “Low” severity class had a higher false positive rate (classifying unburnt areas as burnt).
The interactive map below explores some of the major 2021 fires we mapped in this work.
Click here if you would like to open this map in a new window:
Mapping Flood Damage to Roads
To map road damage from the floods, we relied on the BC Ministry of Transport and Infrastructure Flickr page. This page was a great resource, providing photos and descriptions of the various road damage locations, most of which also contained photo location information.
Where photo location information was available, mapping the damage was a simple matter. When photo location metadata wasn’t provided, we used context clues in the photo description combined with examining satellite imagery and Google Street View images to map locations with a high level of confidence.
In total, we were able to map 36 separate locations of damage. These locations were spread across the following highways:
| Highway Designation | Highway Name | Number of Damage Locations |
| BC Highway 5 | Coquihalla Highway | 13 |
| BC Highway 8 | Nicola Highway | 13 |
| BC Highway 1 | Trans-Canada Highway | 6 |
| BC Highway 3 | Crowsnest Highway | 1 |
| BC Highway 7 | Lougheed Highway | 1 |
| BC Highway 12 | Lytton-Lillooet Highway | 1 |
| BC Highway 99 | Sea-to-Sky Highway | 1 |
The map below explores the damage locations and how they relate spatially to the rainfall from the atmospheric river and the 2021 wildfires.
Click here if you would like to open this map in a new window:
Adapting to the New Normal
The work presented here is not intended to prove or quantify how recent wildfires enhanced the flood damage in southern BC in 2021. The causes of flood damage are complex and involve the interplay of many different environmental and engineering variables.
A full analysis would require consideration of more types of data including slope, soil type, proximity to rivers, changes to landcover, and other known factors which contribute to flood damage risk.
Instead, we have tried to show there are some compelling correlations between recent fires and flood damage. Given the evidence presented here and the known relationship between fire and flooding, it seems clear that accurate and timely mapping of wildfire damage is an important part of being able to assess the risk that severe flooding poses to our settlements and critical infrastructure.
The cascade of natural disasters that occurred in BC in 2021 were both tragic and costly. Unfortunately, events like these are predicted to increase in frequency and severity. As predictions continue to become reality, geospatial data and technology will play a key role to help us adapt to this New Normal.
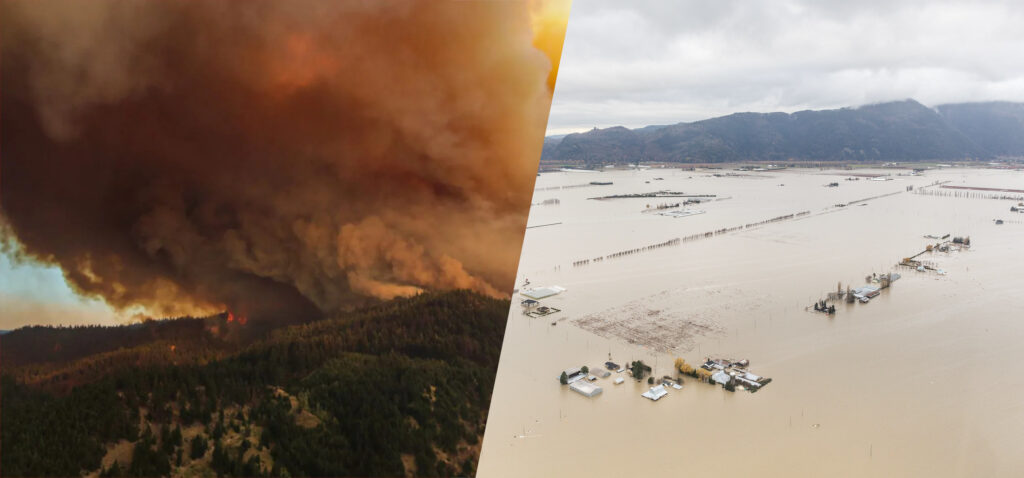
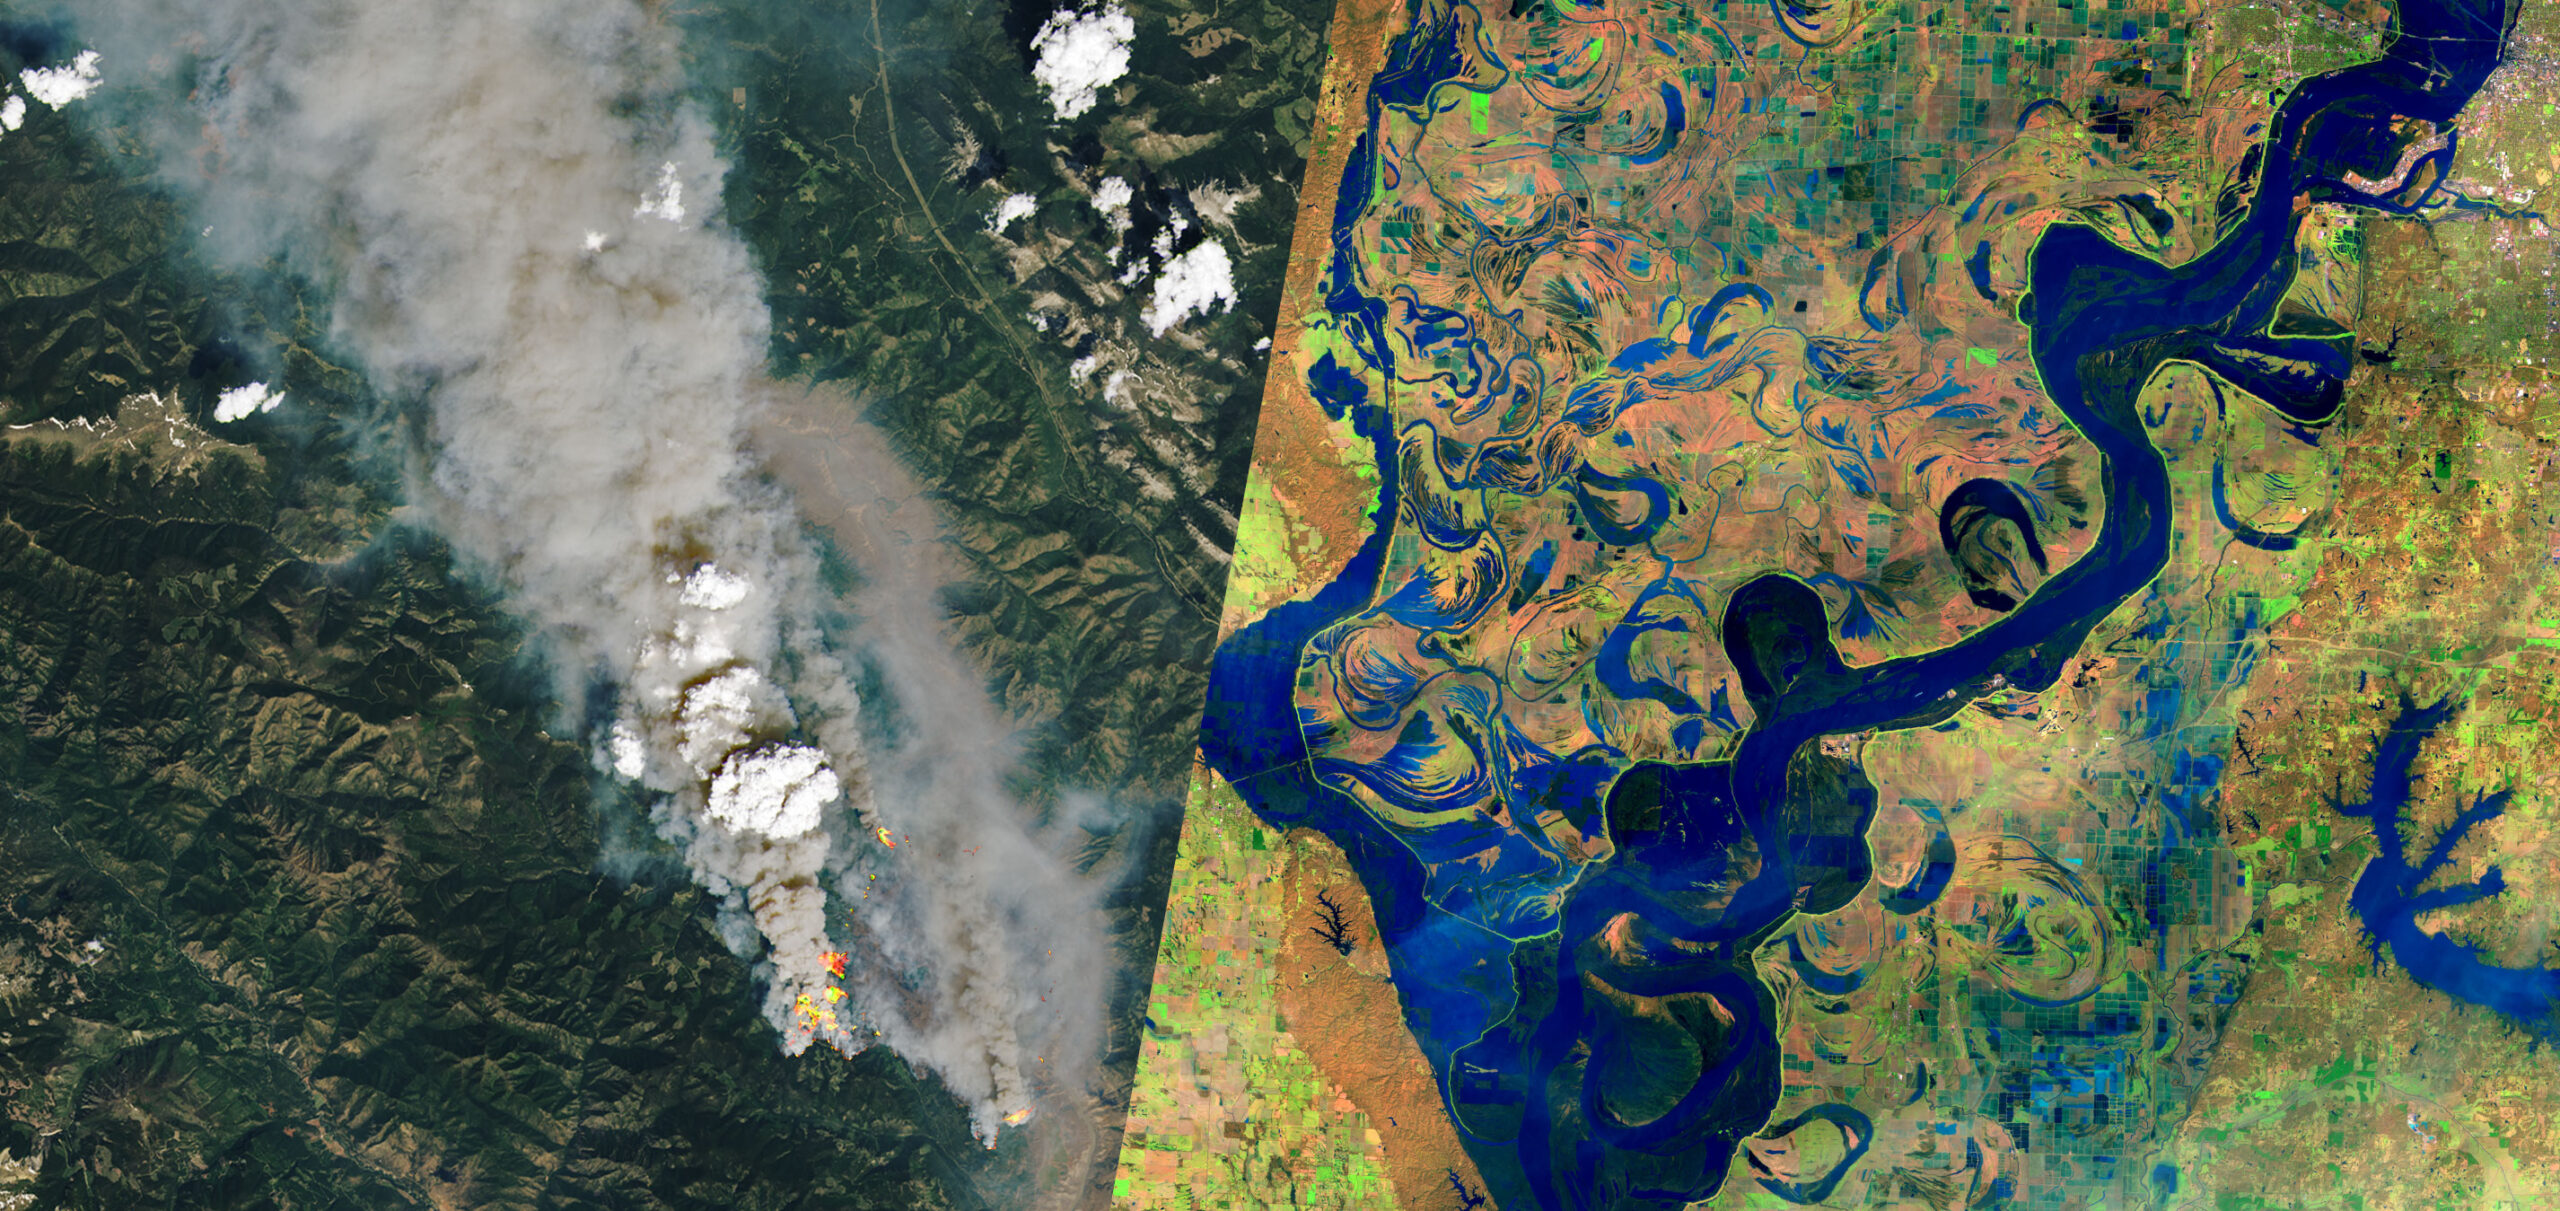
Left: The White Rock Lake wildfire sends clouds of smoke into the sky (image source).
Right: Flooded farmland in the Sumas Prairie near Abbotsford (image source).
Sincere thanks to Natalia Domarad, James Banting, Rolitta Babu, Jonathan Critchley, Kaela Hayes, Chloe Papalazarou, and Rajtantra Lilhare for their contributions to this work.